
Solar System Return on Investment in 2026: Three Scenarios for Commercial and Industrial Properties with Their Own Systems
Excerpt
This article is intended for businesses and decision-makers in the commercial and industrial sectors—including manufacturing, logistics, agriculture, and retail—who are considering in 2026 whether installing their own solar power system on their roof or business premises is a sound investment. Using three realistic scenarios, it demonstrates the economic viability of the investment, the factors that influence the return on investment, and key considerations during the planning phase. The focus is on energy costs, payback period, and long-term planning security—not a capital investment, but operational self-sufficiency.
What will be the return on investment for commercial and industrial solar power systems in 2026—and when will the investment pay for itself? Three detailed scenarios show the actual returns for a manufacturing facility, a logistics center, and an open-space solar power system with direct sales—including all costs, factors that reduce returns, and the key difference between self-consumption and feeding electricity into the grid.
You can find a general overview of industrial PV systems in our guide.
-
For commercial businesses with high self-consumption , a return on investment (IRR, dynamic over 20 years) of 7–9% per annum is achievable—with a payback period of 7–9 years. The strongest return lever: Every kilowatt-hour of solar power consumed on-site saves 16–27 cents in commercial electricity from the grid, while energy fed into the grid yields only 5.50–7.78 cents in feed-in tariffs. The acquisition costs for a commercial PV system will reach a historic low in 2026 (~€1,015/kWp). Starting in year 21, the photovoltaic system effectively produces free electricity—self-consumption continues at marginal costs close to zero.
Don't have your own business, but interested in investing? → Invest in PV as a capital investor — without owning your own system
1. Why self-consumption makes all the difference
The most important point regarding the cost-effectiveness of a solar power system in 2026: Every kilowatt-hour of solar power that your business consumes itself is worth 3–4 times as much as a kilowatt-hour fed into the grid—because it saves you the full commercial electricity purchase price rather than the low feed-in tariff.
In 2026, the EEG feed-in tariff will be 7.78 cents per kilowatt-hour for partial feed-in (up to 10 kWp) and 5.50 cents per kilowatt-hour (40–100 kWp). Those who opt for full feed-in, as an exception, receive 12.35 cents per kilowatt-hour —but even this rate is well below the commercial electricity price. The feed-in tariff is guaranteed for 20 years from commissioning and remains constant for existing systems, regardless of any subsequent reductions. Your commercial electricity rate, on the other hand, ranges from 16 to 27 cents per kilowatt-hour depending on the company and electricity consumption—every kWh you use yourself saves this amount in full. That is the real driver of PV returns for businesses, not government subsidies.
Spreading in practice:
Feed-in (EEG remuneration): 5.50–7.78 cents/kWh revenue
Self-consumption by small businesses: ~27 cents/kWh in avoided grid purchases → Cost savings per kWh: ~19 cents more than feed-in
Self-consumption by SMEs / Production: 18–24 cents/kWh in avoided grid purchases
Industrial self-consumption: 14–18 cents/kWh in avoided grid purchases
It follows that maximizing the self-consumption rate is the most important factor in determining the return on investment for a photovoltaic system —even more so than system size, battery storage, and the sales model. Anyone who optimizes their PV system primarily for grid feed-in is throwing away the lion’s share of the potential savings.
In 2026, PV operators will benefit from a key strategic advantage: planning certainty. Self-generated solar power has long-term production costs of 5–8 cents per kilowatt-hour (Fraunhofer ISE, July 2024) — commercial electricity prices from the grid, on the other hand, fluctuate with the energy markets. Businesses that cover part of their electricity needs with their own PV systems make their energy costs more predictable in the long term.
Another aspect that is often underestimated: Investing in your own solar power system also makes a measurable contribution to the energy transition and the company’s sustainability strategy—more and more clients and lenders are asking for concrete proof of climate protection efforts.
2. Commercial Electricity Rates in 2026: What Your Business Will Actually Pay
In 2026, commercial electricity prices in Germany will range from 14 to 27 cents per kilowatt-hour—depending on annual consumption, usage patterns, and the grid fee tier. This commercial electricity rate directly determines how much your business can save on electricity costs by generating its own power with a solar PV system.
As of January 2026, Source: BDEW Electricity Price Analysis:
Small businesses (annual consumption up to ~50,000 kWh)
Electricity price: ~27 cents/kWh (gross, including VAT)
Self-consumption value per kWp of PV: very high
Typically: retail businesses, small businesses, and small service providers
Medium-sized businesses / SMEs (annual consumption: 50,000–500,000 kWh)
Electricity price: 18–24 cents/kWh (net)
Self-consumption value per kWp of PV: high
Typical: Manufacturing facilities, contract manufacturers, agriculture
Industry / Large-scale business (annual consumption over 500,000 kWh)
Electricity price: 14–18 cents/kWh (net)
Self-consumption value per kWp of PV: moderate
Typical examples: manufacturing plants, logistics centers, manufacturing industry
Overview of key pricing components for 2026:
Electricity tax: 2.05 cents/kWh (manufacturing sector: permanently exempted from half the rate)
KWKG surcharge: 0.446 cents/kWh (+61% compared to 2025)
Grid fees: vary significantly by region; federal subsidy reduces costs by ~2 cents/kWh
There is one clear requirement for your PV cost estimate: Use your actual electricity rate (net), not an industry average. In some cases, using the wrong rate—such as a small business rate instead of an industrial rate—can skew the profitability calculation by 30–50%. This is the most common error made when calculating PV returns for businesses.
Sources: BDEW Electricity Price Analysis, January 2026; Federal Network Agency/SMARD 2024; Wattline Commercial Electricity Prices, February 2026
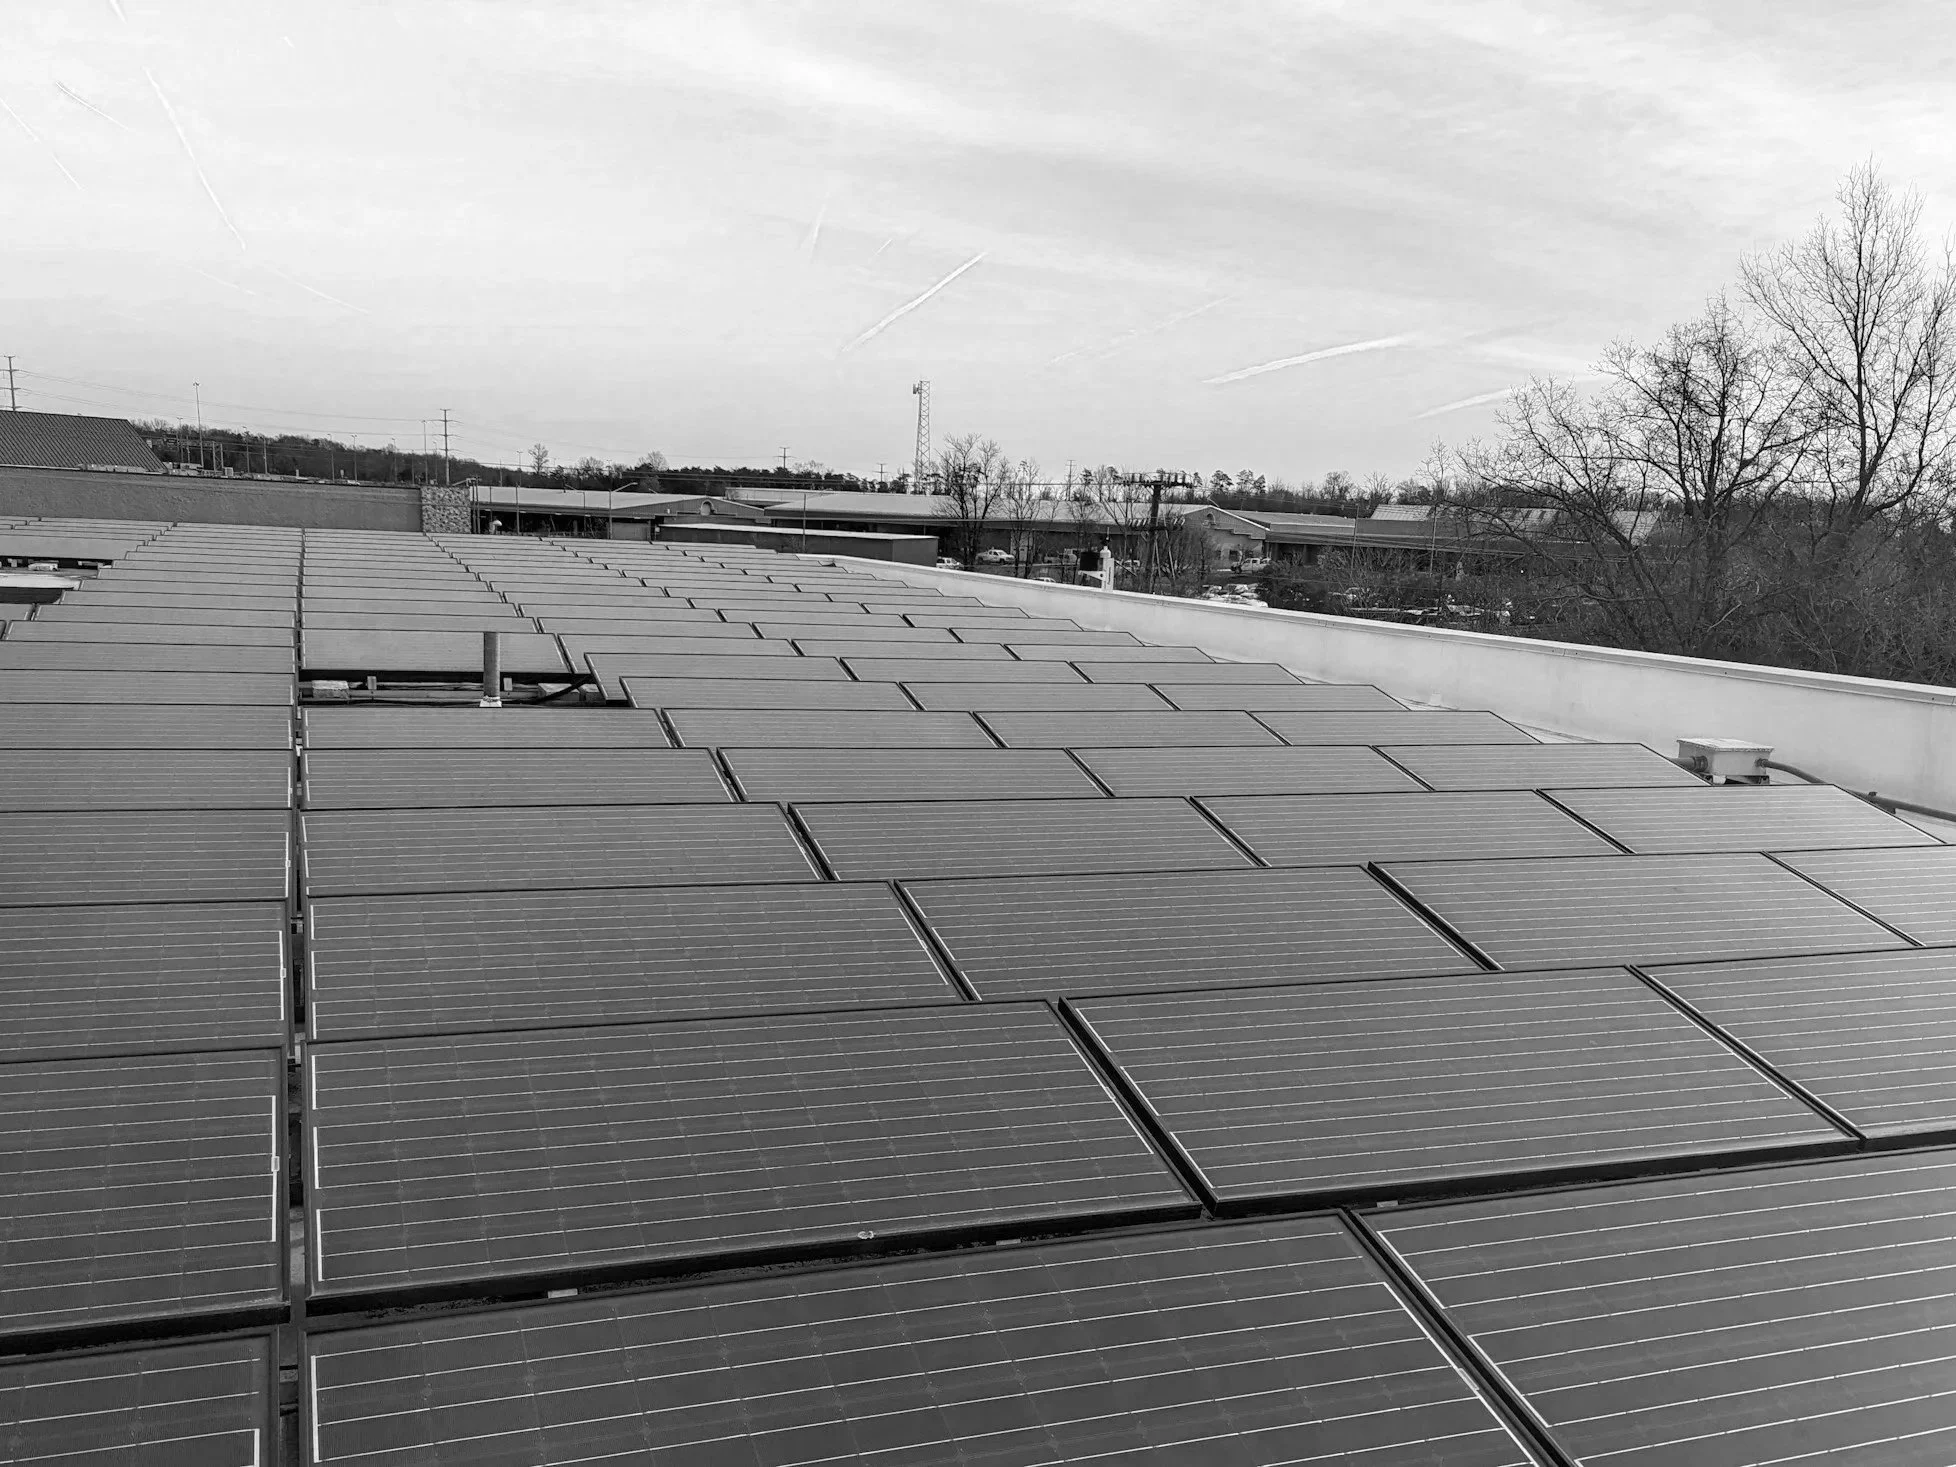
3. Scenario A: 100 kWp power plant without storage
A 100-kWp photovoltaic system installed at a medium-sized manufacturing facility operating on a day shift is projected to generate an internal rate of return (IRR) of approximately 8–10% per annum over a 20-year period in 2026—with a payback period of about 8 years and a total profit of approximately €170,000–210,000 after deducting the investment.
An Overview of Return Metrics — What Do They Mean?
Static annual return: Net income in year 1 ÷ total investment. Easy to calculate, but overestimates the long-term return because it ignores depreciation and the time value of money.
IRR (dynamic, 20 years): Takes into account degradation (0.5% per year), electricity price increases (assumed to be +2% per year), and the time value of money. It is typically 3–5 percentage points lower than the static annual rate of return —and is the more realistic figure for investment decisions.
Model assumptions
Location: Central Germany, south-facing roof
Initial costs / system costs: €1,100/kWp → Total investment: €110,000
Annual output: 100,000 kWh (1,000 kWh/kWp, average for Central Germany)
Commercial electricity rate: 22 cents/kWh (net, medium-sized commercial/manufacturing)
Self-consumption rate: 60% (Daytime electricity demand: production operations, Mon–Fri)
EEG feed-in tariff (weighted, partial feed-in): 6.17 ct/kWh(10 kWp × 7.78 ct + 30 kWp × 6.73 ct + 60 kWp × 5.50 ct = avg. 6.17 ct)
Operating costs: 1.5% per annum of the investment value
Market Update: As of April 1, 2026, China has completely eliminated VAT export rebates for solar modules (joint announcement by the Ministry of Finance and the State Taxation Administration, January 9, 2026). Industry experts forecast a cumulative 10–20% increase in module prices through 2026—individual manufacturers such as Jinko Solar even warned of increases of up to 30–40% in Q1. A transition period applies to battery storage: the rebate will decrease from 9% to 6% by the end of 2026, with complete elimination effective January 1, 2027. Those who invest in 2026 will still secure the current rock-bottom prices—the system costs in the model above apply to systems ordered before the price increase.
Annual Financial Statements, Year 1
Revenue:
Self-consumption (electricity cost savings): 60,000 kWh × €0.22 = €13,200
Feed-in (EEG remuneration): 40,000 kWh × €0.0617 = €2,468
Gross revenue: €15,668
Costs:
O&M, Insurance: −€1,650
Net income for Year 1: ~€14,018
Results at a glance
Static annual return (Year 1): ~12.7%(indicative figure; overestimates the long-term return)
Dynamic return on investment / IRR over 20 years: ~8–10%(realistic planning figure)
Payback period: ~7.9 years
Total profit over 20 years after deducting the investment: approx. €170,000–210,000
4. Scenario B: 100 kWp with battery storage
A 50-kWh battery storage system increases the self-consumption rate from 60% to 80% and boosts the annual net revenue by approximately €2,800. The payback period for the entire system remains at around 8 years—the storage system itself pays for itself in about 9 years.
More details on commercial storage systems, costs, and cost-effectiveness: Commercial PV battery storage.
Changes compared to Scenario A
Total investment: €135,000 (+ €25,000 for 50 kWh of battery storage at €500/kWh)
Self-consumption rate with storage: 80% — compared to 60% without storage
Operating costs: 1.5% per year (including storage maintenance)
Annual Financial Statements, Year 1
Revenue:
Self-consumption (electricity cost savings): 80,000 kWh × €0.22 = €17,600
Feed-in: 20,000 kWh × €0.0617 = €1,234
Gross revenue: €18,834
Costs:
O&M: −€2,025
Net income for Year 1: ~€16,809
Results at a glance
Static annual return (Year 1): ~12.5%(indicative figure)
IRR over 20 years: ~7–9%(Including ~20% loss in storage capacity after 10 years)
Payback period for the entire system: ~8.0 years
Additional revenue from battery storage vs. Scenario A: +~€2,791/year
Payback period for storage: ~9 years
When is a battery storage system particularly cost-effective?
For businesses with power-price-based commercial electricity billing, the storage system saves an additional €5,000–15,000 per year on the power price component through peak shaving—this benefit is not yet included in the figures above. Added to this is protection against negative electricity prices: Those who store excess PV energy in the storage system instead of feeding it into the grid do not lose revenue during hours of negative market prices (2025: 575 hours).
5. Scenario C: 500 kWp ground-mounted system with direct sales
Larger photovoltaic systems of 100 kWp or more must be sold directly to the grid—not at the EEG feed-in tariff, but at the spot market price plus a government market premium. For a 500-kWp ground-mounted PV system, an internal rate of return (IRR) of 7–9% over 20 years is achievable if self-consumption and direct sales are strategically combined.
What direct sales actually means and what the current prices are: Direct sales of solar power — current prices and models.
Model assumptions
Location: Central Germany, east-west open space
System costs: €900/kWp (economies of scale starting at 200 kWp) → Total investment: €450,000
Annual output: 475,000 kWh (950 kWh/kWp, east-west orientation)
Commercial electricity rate: 20 cents/kWh (net, industrial electricity)
Self-consumption rate: 50% (Electricity demand: large-scale operation with shift work)
Direct sales (feed-in portion): ~5.0 ct/kWh net (average solar market price in 2025: 4.51 ct/kWh + market premium; minus direct sales costs of 0.30 ct/kWh (variable) + €500/year (fixed))
Annual Financial Statements, Year 1
Revenue:
Self-consumption (energy cost savings): 237,500 kWh × €0.20 = €47,500
Direct sales (revenue from feed-in): 237,500 kWh × €0.050 = €11,875
Gross revenue: €59,375
Costs:
O&M (operating costs): −€6,750
IT costs: −€1,212
Net income for Year 1: ~€51,413
Results at a glance
Static annual return (Year 1): ~11.4%(indicative figure)
IRR over 20 years: ~7–9%(including depreciation and DV price fluctuation risk)
Payback period: ~8.8 years
Total profit over 20 years: approx. €550,000–€640,000 after deducting the initial investment
Important Information About Direct Marketing
Since the Solar Peak Act (February 2025), the market premium is no longer paid when electricity prices on the exchange are negative—in 2025, this occurred for 575 hours. This can cost 3–5% of the projected feed-in revenue. A battery storage system can isolate these periods of negative prices and significantly reduce the risk.
Sources: Fraunhofer ISE LCOE July 2024; Elevion Green cost data 2026; EPEX SPOT solar market value 2025
6. Profit-Eaters and Common Calculation Errors
Many cost-benefit analyses for PV systems overestimate the return on investment by 2–4 percentage points—because six typical cost items are miscalculated or omitted entirely. Those who are aware of these errors can make realistic calculations.
Error 1: Incorrect commercial electricity rate Using the small business rate (27 ct/kWh) instead of the actual industrial rate (15–18 ct/kWh) overestimates the savings from self-consumption by 30–50%. Always use your own (net) electricity rate from your current electricity bill.
Mistake 2: Underestimating the lifetime costs of the battery storage system. The cost of replacing the inverter after 10–15 years (€5,000–15,000) and the loss of storage capacity (~20% after 10 years) are often omitted from initial calculations. Realistic total cost of ownership over 20 years: 20–40% of the investment value.
Mistake 3: Ignoring negative electricity prices. In 2025, there were 575 hours of negative exchange prices—feed-in tariffs and market premiums are completely eliminated during these hours (Peak Solar Act, effective February 2025). When the proportion of electricity fed into the grid is high, this results in a loss of 3–5% of projected revenue.
Mistake 4: Underestimating Shading Roof structures, chimneys, neighboring buildings—in practice, shading often results in a 10–30% loss in energy yield. Every reputable quote includes a shading analysis (e.g., PVsyst); if it’s missing, that’s a red flag.
Mistake 5: Financing costs are not factored in Even low-interest KfW 270 loans (currently starting at ~3.25% per annum) extend the payback period by 1–3 years when the project is fully financed. Returns calculated purely on the basis of equity are not meaningful for debt-financed investments.
Mistake 6: Incorrect system size relative to electricity demand Installing a 500 kWp system on a commercial roof with an annual consumption of only 200,000 kWh results in a high feed-in ratio and significantly reduces the average profit margin. Rule of thumb: Annual PV generation should be a maximum of 70–80% of annual consumption —anything above that increasingly goes toward feed-in at a lower rate.
Mistake 7: Forgetting registration and notification requirements Every commercial photovoltaic system must be registered with the grid operator before commissioning in order to be permitted to feed electricity into the grid. Registration in the Market Master Data Register is mandatory within one month of commissioning—failure to do so will result in the loss of the feed-in tariff or market premium (§19 MaStRV). Anyone who fails to factor these steps into their project planning risks delays in receiving their first revenue.
Mistake 8: Not taking advantage of KfW funding KfW provides funding for commercial PV systems through Program 270 (Renewable Energy Standard) with interest rates starting at ~3.25% per annum—without a principal repayment subsidy, but with a loan volume of up to €150 million per project. Applications must be submitted through the applicant’s primary bank before the project begins. Those who skip this step miss out on low-interest financing options that can significantly improve the effective return on equity.
7. How the solar power system pays for itself after 20 years
The period following the expiration of the 20-year EEG feed-in tariff is often the most profitable for operators: The photovoltaic system has been fully depreciated, the investment costs are zero—but the system continues to produce solar power for another 10–15 years.
After 20 years, the EEG feed-in tariff and market premium will no longer apply. What remains for the business:
Self-generation: continues to save the full commercial electricity rate (at prevailing market prices)
Direct sales at spot market prices: still possible—without a market premium, but also without capital costs
System output after 20 years: approx. 85–90% of the original output (0.5% annual degradation over the system's lifetime)
Model calculation for Scenario A — Operations in years 21–30
Remaining capacity: ~90 kWp
Annual output: ~90,000 kWh
Self-consumption (60%): 54,000 kWh × €0.17/kWh (conservative commercial electricity rate for 2046) = €9,180/year
Other operating costs: −€1,400/year
Annual net income for years 21–30: ~€7,780
Additional profit over the remaining 10 years: ~€77,800 — with no remaining investment costs
Anyone who only factors in the first 20 years when purchasing a photovoltaic system is overlooking a significant portion of the total return. The service life of modern PV systems is 25 years or more —manufacturers typically guarantee 80% of the rated output after 25 years. The EEG subsidy period thus covers only the first half of the technical service life; the second half is operated at marginal costs close to zero.
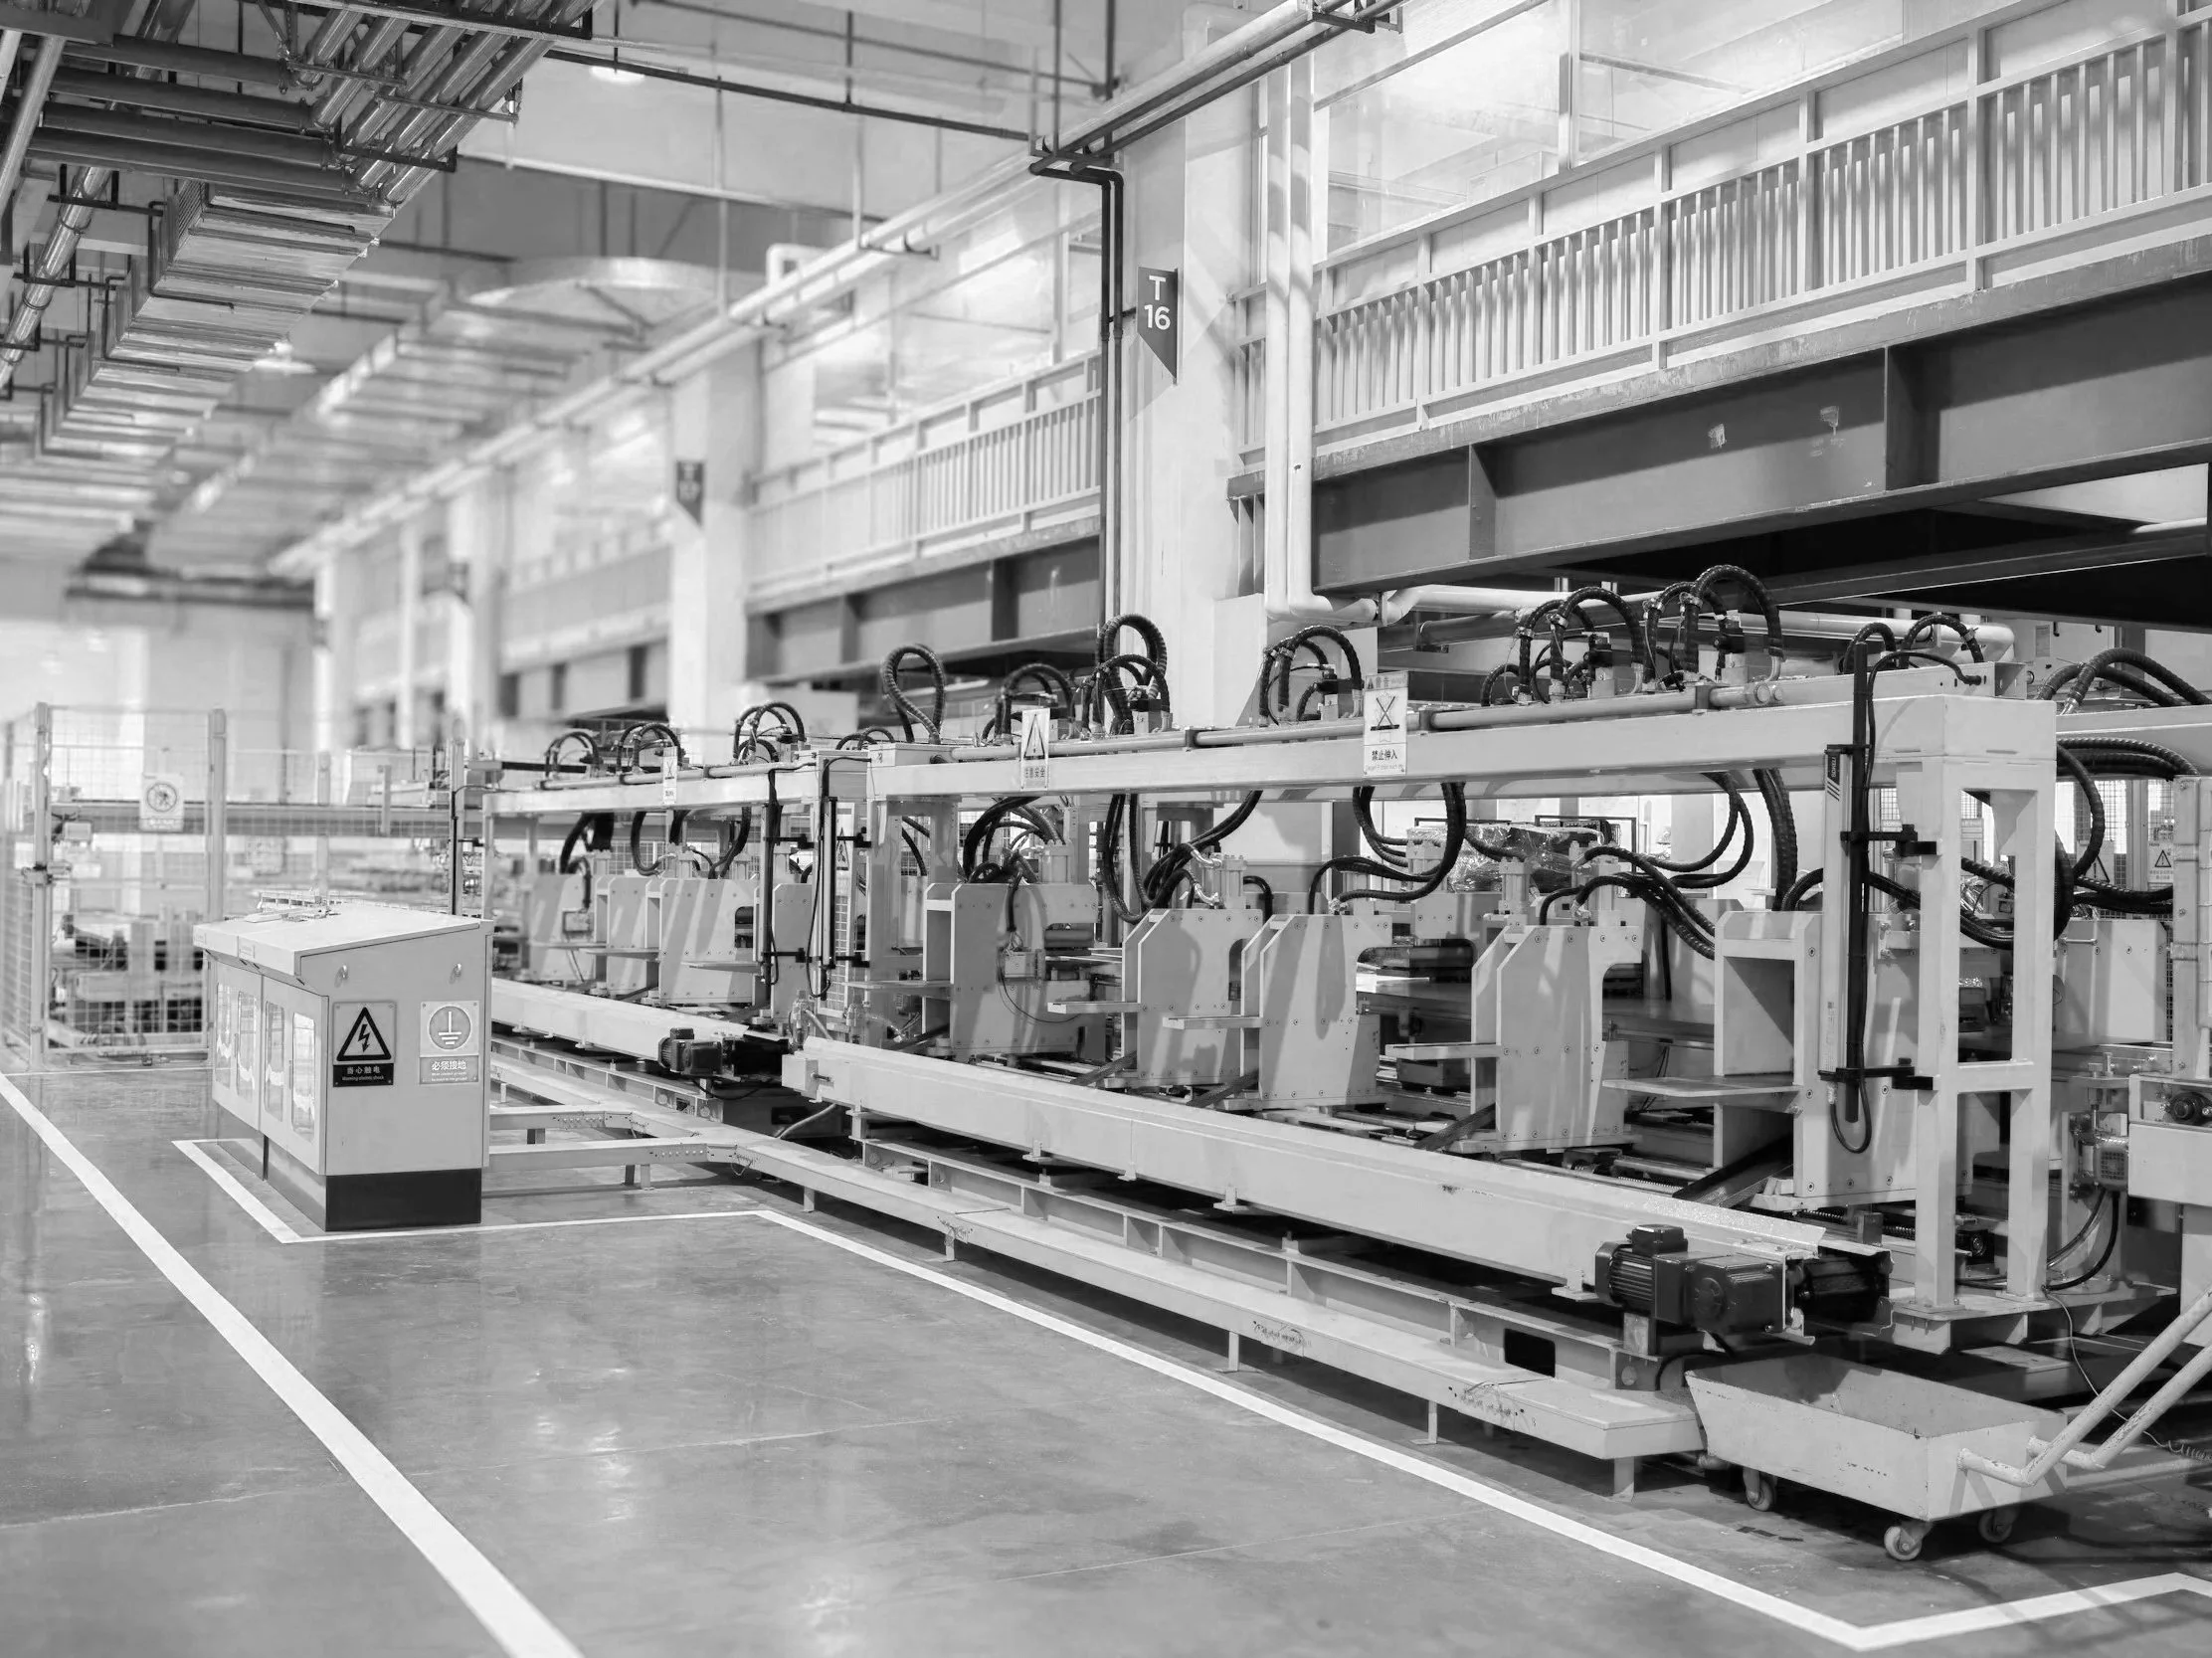
8. Industry-specific: Manufacturing, Logistics, Agriculture, Retail
The self-consumption rate—and thus the return on investment for a solar power system—varies significantly depending on the system’s operating profile. The key factor is when electricity demand arises during the day, not just how high it is.
Production facility (Mon–Fri, day shift)
The most cost-effective profile for self-consumption: High electricity consumption during peak solar production hours (9 a.m. to 4 p.m.) aligns directly with PV generation.
Self-consumption rate without battery storage: 50–70%
With battery storage: up to 80–85%
Particularly suitable for: facilities with compressors, production machinery, compressed air, and air conditioning
Recommended system size: Annual PV generation should be no more than 70–80% of annual consumption
Logistics and Warehousing
Logistics facilities often have large roof areas suitable for solar panels—but their energy consumption patterns are more uneven depending on the shift schedule.
Self-consumption rate without battery storage: 40–60%
Leverage: Shift charging infrastructure for electric forklifts and electric trucks specifically to peak solar hours (10 a.m.–2 p.m.) — this increases self-consumption without the need for storage investment
With active load management: self-consumption can be increased to 65–75%
Economies of scale: Large roof areas often allow for 300–600 kWp at a lower cost per kWp
Agriculture
Agricultural operations have a seasonal energy consumption pattern, but they also have a baseline load from cooling, ventilation, and livestock management—making them an ideal candidate for solar power.
Self-consumption rate without battery storage: 20–50% (subject to significant seasonal fluctuations)
Battery storage is particularly beneficial for dairy farming and refrigeration (24/7 base load)
Key feature: Agri-PV combines solar power generation with agricultural use on the same land—without reducing crop yields for many crops
Also check for specific agricultural subsidy programs (BAFA, state subsidies)
Trade and Retail
Supermarkets and retail businesses benefit greatly from 24/7 refrigeration and air conditioning—their electricity consumption remains constant throughout the day.
Self-consumption rate: 60–85% (due to continuous operation of the cooling system)
Supermarket profiles (G3 load profile) can achieve self-sufficiency rates of nearly 100%
High energy costs associated with cooling make the savings from solar power particularly noticeable
Sources: SMA Solar Self-Consumption Study based on standard load profiles; Ampere Dynamic CH (2025); Solarfuxx Self-Consumption Guide; Elevion Green Commercial Storage 2026
For more information on investments, please see our overview of costs and returns here.
This article is intended solely for general informational purposes and does not constitute investment, tax, or legal advice. Return figures are based on historical data from the Helm Group and market averages—they are not a guarantee of future results. All calculation examples are simplified model calculations that do not take into account individual financing terms, tax profiles, or location-specific factors. For advice tailored to your individual situation, please consult a licensed tax or financial advisor. All information is provided without warranty. As of March 2026.
Don't own a business but interested in PV returns? → Invest in PV as a financial investor—without owning your own system
→ Plan your own PV system for your business
The numbers speak for themselves: Anyone who installs a commercial solar power system on their business roof or open space in 2026 will benefit from historically low acquisition costs and lay the foundation for long-term, cost-effective self-supply with solar power—at marginal costs close to zero starting in 2021. Every business has a different load profile, different commercial electricity rates, and different site conditions—so the actual return on your PV system will differ from the specific example in this article. Logic Energy will prepare a customized profitability analysis for your business, free of charge and with no obligation.
FAQ
-
The IRR (Internal Rate of Return) is a key metric that indicates the average annual return on an investment over its entire term, taking into account all cash flows—including acquisition costs, ongoing revenue, cost increases, and degradation. For facilities with 50–80% self-consumption , an IRR of 7–9% per annum over 20 years is achievable. The static annual return in the first year is higher (11–13%) because it does not yet factor in degradation and time value. Additional advantage: The EEG feed-in tariff is guaranteed for 20 years from commissioning—making it possible to calculate revenue projections for the feed-in portion. All information is provided without warranty, as of March 2026.
-
Turnkey cost: approx. €950–1,300/kWp — or €95,000–130,000 for 100 kWp. The current market average is ~€1,015/kWp (Fraunhofer ISE / Market data Q1 2026) — a historic low.
-
Day-shift manufacturing facilities: 50–70% without battery storage, 70–85% with storage. Logistics: 40–60% without, 60–75% with storage. Retail with refrigeration: 60–85%. In individual cases, the percentage depends on how well the consumption profile aligns with solar power generation over time.
-
If your commercial electricity rate is over 18 cents/kWh and your self-consumption rate is below 65%, a commercial battery storage system typically pays for itself in 6–9 years. With power-based billing, peak shaving can save an additional €5,000–15,000 per year in energy costs.
-
The system continues to operate—at approximately 85–90% of its original capacity. While the EEG feed-in tariff no longer applies, self-consumption continues to save the full cost of commercial electricity. The lifespan of modern photovoltaic systems is 25 years or more —once the system has been amortized, years 21–30 are often the most profitable because no further capital costs are incurred.
-
100 kWp or more (Section 22(3) of the EEG 2023). In this case, you will receive the market value of solar power plus a government market premium instead of the fixed EEG feed-in tariff. The market premium is approximately 0.4 cents/kWh higher than the fixed tariff—and thus also covers the costs of direct marketing.
-
The IAB (up to 50% upfront, max. €200,000), special depreciation (40%), and declining-balance depreciation (max. 15% per year for PV systems, valid until December 31, 2027) can be combined. For an investment of €110,000, this means that up to 77% of the costs can be deducted for tax purposes in the first two years. Details: Save on taxes with photovoltaics — IAB and depreciation 2026. Consult a tax advisor.
References
BDEW — Electricity Price Analysis, January 2026 — Commercial Electricity Prices by Consumption Category, January 2026
Wattline — 2026 Electricity Rates for Businesses — Commercial Electricity Rates and Rate Components, February 2026
pv magazine — China to abolish solar export tax rebates starting in April — Abolition of VAT export rebates for PV effective April 1, 2026, January 9, 2026
PV Tech — Scrapping of China's PV export tax rebate sparks panic buying and a surge in module prices — Manufacturer price hikes and market reaction, January 26, 2026
Fraunhofer ISE — Levelized Cost of Electricity for Renewable Energies — LCOE Data for Rooftop and Ground-Mounted PV, July 2024
Elevion Green — How Much Will a 100-kWp PV System Cost in 2026? — System Costs and Payback Calculation, 2026
Elevion Green — Commercial Storage for PV Systems — Costs, Increased Self-Consumption, Cost-Effectiveness, 2026
gruenes.haus — Photovoltaic Price Trends Through March 2026 — Module Prices, System Costs, pvXchange Data, March 2026
photovoltaik.org — Feed-in Tariff 2026: Rates & Updates — Current EEG Tariff Rates, 2026
energie-experten.org — Feed-in Tariff 2026: Current Rates & Tables — Tariff Rates for Partial and Full Feed-in, 2026
Finanztip — Feed-in Tariff 2026: Amount, Trends & Planned Reforms — CfD Outlook, March 2026
Solar.red — Calculate Self-Consumption for PV Systems in 2026 — Self-Consumption Rates by System Type, 2026
Solarfuxx — Commercial Self-Consumption of Solar Power — Planner's Guide to Optimizing Self-Consumption
Ampere Dynamic — Self-consumption from 30% to 90%: Optimizing Industrial Operations — Case Studies, 2025
SMA Solar — Commercial Self-Consumption of Solar Power — Self-consumption rates based on standard load profiles
Ohana Invest — Photovoltaic IAB + Depreciation — Tax Planning Options for 2026
leospardo.de — Commercial Solar Power in 2026: Costs, Subsidies & Tax Benefits — Depreciation Rules, 2026
Helm Group — Portfolio Return Data for 2024 — Internal Project Data, Returns of 6–10% p.a.