
Solar Power vs. Lignite 2025: How Solar Power Will Surpass Lignite and Natural Gas for the First Time
Excerpt
In 2025, photovoltaics surpassed lignite in net electricity generation in Germany for the first time—with 87–90 TWh compared to 67 TWh from lignite and a share of the electricity mix of around 18%. At the same time, the storage market broke the 25-GWh mark, and negative electricity prices reached a new record of 573 hours. What this shift in trends specifically means for investors in PV systems—this article provides the figures and analysis.
This article is primarily intended for investors interested in investing in solar power systems. Businesses looking to install their own solar power system for their operations can find the information they need under "Solar Power System for Your Business."
-
This article examines why photovoltaics surpassed lignite in German electricity generation for the first time in 2025—and what specific opportunities this presents for investors in PV systems.
In 2025, solar power surpassed lignite for the first time in Germany in terms of net electricity generation: approximately 90 TWh of solar power compared to just 67 TWh from lignite. The share of renewable energy in Germany’s electricity mix reached nearly 56% of total electricity consumption, and at the EU level, wind and solar power exceeded the combined output of all fossil fuels for the first time. For investors, this means: The energy transition has passed a tipping point that can no longer be reversed—but the simultaneous record for negative electricity prices (573 hours) shows where the next potential for returns lies: in battery storage.
Table of Contents
Lignite production has fallen to 1961 levels—while solar power capacity continues to grow
EU Outlook: Share of Renewable Energy Exceeds That of Fossil Fuels for the First Time
573 hours of negative electricity prices – a record with consequences
Storage Market: 25 GWh Cumulative Capacity, Large-Scale Storage Grows by 62%
Three Drivers: Why Renewable Energy Will Set the Pace in 2025
1. Overtaking in Numbers
In 2025, solar power will surpass lignite for the first time in terms of net electricity generation in Germany—a record high that is unprecedented in German energy history. Specifically, this means that in 2025, photovoltaics accounted for about 18% of Germany’s gross electricity consumption and generated around 87–90 TWh of electricity, while lignite fell to 67.2 TWh. Solar has thus risen to become the second-largest energy source in the German electricity mix—behind wind power (approx. 132 TWh), but well ahead of lignite, the long-standing market leader.
Key figures from the annual report of the Fraunhofer Institute’s Energy Charts (Version 9, as of March 28, 2026, compiled by Prof. Bruno Burger and Leonhard Gandhi) and the Federal Network Agency’s SMARD—the most important data source for the German solar market:
Production & Growth
Total PV generation in 2025: approx. 87–90 TWh (of which ~70–71 TWh will be fed into the public grid and ~19.8 TWh will be used for self-consumption)
Share of the electricity mix in gross electricity consumption: ~18%
Growth compared to 2024: +21% or +15–16 TWh
Upgrades & Performance
Installed PV capacity by the end of 2025: 116.8 GWp (DC)
Net capacity additions in 2025: 16.2–17.0 GWp
Peak PV output: 50.4 GW on June 20, 2025, at 12:45 p.m.
Daily record: 41.2% of daily public electricity demand covered by solar power on June 21, 2025
Solar Year 2025
Sunshine hours: 1,945 hours (+16% compared to 2024)
Total solar radiation: 1,187 kWh/m² (+6.6% compared to 2024)
⚠️ Figures for installed capacity and new installations vary slightly depending on the source (Federal Network Agency: 16.4 GW; BSW-Solar: 17.5 GW; BDEW: 17.7 GW), as late reports are entered into the market master data registry with a delay. All figures are provided without guarantee. As of February 2026.
Now that the figures confirm this shift, let’s examine how lignite has evolved over time—and why this decline is structural, not cyclical.
Germany's Energy Mix in 2025: Solar Power Overtakes Lignite and Natural Gas
The 2025 electricity mix shows the new ranking of all electricity generation sources in the public grid (approx. 419.5 TWh total generation):
Total wind energy: ~132 TWh (approx. 31% share)
Solar power: ~70–71 TWh (approx. 16–17%)
Lignite: ~67.2 TWh (approx. 16%)
Natural gas: ~50–52 TWh (approx. 12%)
Biomass: ~36 TWh (approx. 9%)
Bituminous coal: ~26.7 TWh (approx. 6%)
Hydropower: ~17 TWh (approx. 4%)
Total share of renewable energy: ~55.9%
| Energy sources | Generation (TWh) | Percentage (%) | Change from 2024 |
|---|---|---|---|
| Wind energy (total) | ~132 | ~31 % | –3,2 % |
| Photovoltaics ★ | ~70–71 | ~16–17% | +21 % |
| Lignite | 67,2 | ~16 % | –5,4 % |
| Natural gas | ~50–52 | ~12 % | +6,4 % |
| Biomass | ~36 | ~9 % | –0,6 % |
| Bituminous coal | 26,7 | ~6 % | +3,0 % |
| Hydropower | ~17 | ~4 % | declining |
| Total renewables | ~235 | ~55,9 % | +0,4 % |
★ Ahead of lignite and natural gas for the first time. Source: Fraunhofer ISE Energy Charts v9 / BNetzA SMARD, as of March 2026. Public net electricity generation excluding on-site consumption by industry.
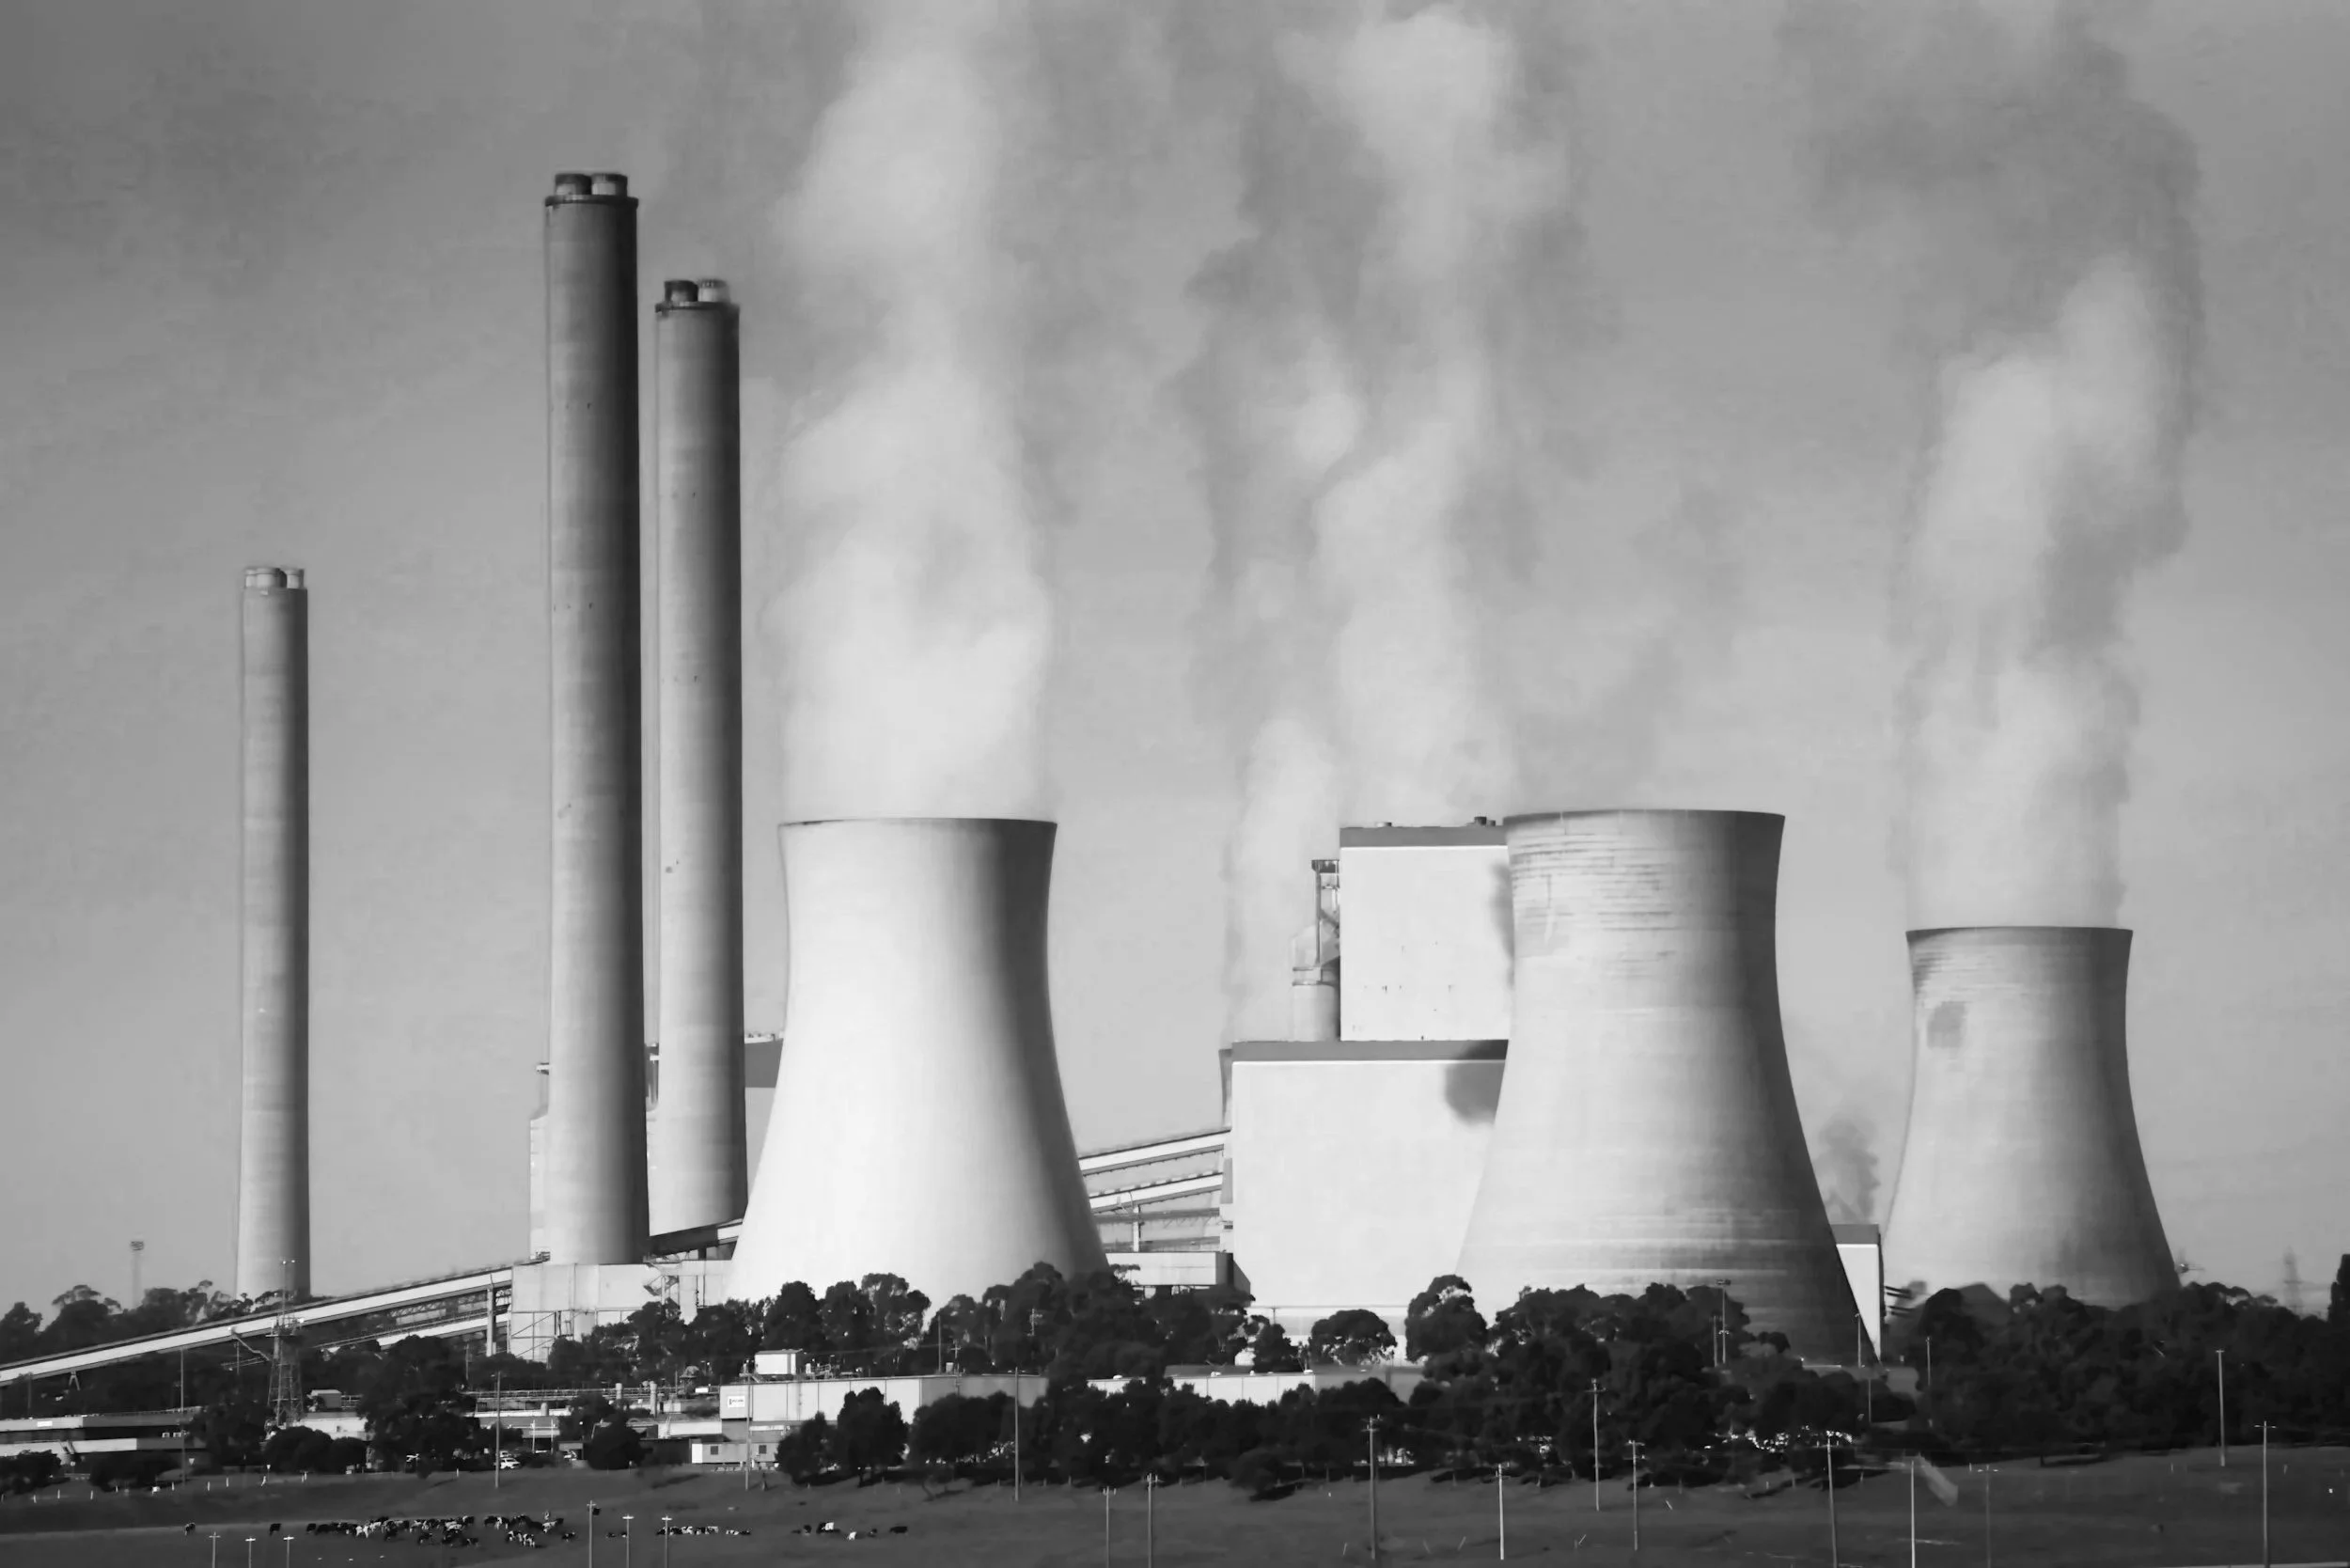
2. Lignite production has fallen to 1961 levels—while solar power capacity continues to grow
Net electricity generation from lignite fell to 67.2 TWh in 2025—a 5.4% decline from the previous year and, according to Fraunhofer ISE, the lowest level since 1961. Lignite and hard coal combined fell to a historic low of 95.4 TWh—while installed photovoltaic capacity grew to over 116 GW due to continuous PV expansion.
The picture is clear: while lignite has been in decline for years, solar power has been growing steadily. The gap has widened dramatically in just five years:
The Development of Solar Power vs. Lignite in Germany
2020 – Lignite ~90 TWh · PV ~50 TWh → Difference: 40 TWh in favor of lignite
2024 – Lignite ~71 TWh · PV ~74 TWh (gross generation) → PV catches up for the first time
2025 – Lignite ~67 TWh · PV ~90 TWh → PV surpasses lignite by ~23 TWh
Why lignite and natural gas are being structurally displaced
Because of its near-zero marginal costs, solar power is primarily fed into the grid, which systematically pushes inflexible lignite-fired power plants out of the market—this principle is known as the merit-order effect. Lignite and natural gas have a structural cost disadvantage compared to solar plants: With production costs close to zero, solar plants always offer their solar power first; power plants with high variable costs are thus increasingly being structurally displaced in modern energy systems. Added to this is a first factor: Declining electricity demand in heavily electrified industries further intensifies the displacement effect.
⚠️ Historical data on lignite production is taken from the Fraunhofer Institute’s 2025 Energy Charts Annual Report. All figures are provided without guarantee. As of March 2026.
What holds true domestically is even more evident in the pan-European picture—as the next section shows.
3. EU Outlook: Share of renewable energy exceeds that of all fossil fuels for the first time
At the EU level, solar energy did not just surpass coal in 2025—for the first time, wind and solar power together generated more electricity than all fossil fuels combined. According to the Ember European Electricity Review 2026, solar power generation in the EU-27 totaled 369 TWh (+20%), while coal fell to a historic low of 257 TWh.
Key figures for the European market:
EU Solar 2025: 369 TWh (+62 TWh compared to 2024, +20%)
EU coal in 2025: 257 TWh (all-time low, down 4.5% from 2024)
Wind + solar combined: 30.1% (841 TWh) – exceeding all fossil fuels for the first time (29.0%, 809 TWh)
Coal share: Germany (103 TWh) and Poland (87 TWh) together account for 74% of all coal-fired electricity in the EU
19 out of 27 EU countries have a coal share of zero or less than 5%
The European solar divide —the growing gap between EU countries with solar expertise and those dependent on coal—is thus widening further. For German PV investors, this is a competitive advantage: despite the decline in lignite use, Germany has a well-established infrastructure for the planning, construction, and operation of large-scale plants, which other markets have yet to build.
However, Europe’s lead has a systemic side effect: the more solar power flows into the grid, the more often electricity prices dip below zero—as the following section shows.
4. 573 hours of negative electricity prices – a record with consequences
In 2025, Germany recorded approximately 573 hours of negative day-ahead prices—an increase of about 25% compared to the previous record of 457 hours in 2024. At first glance, this may seem like a threat to PV investors, but it is primarily a signal: the market needs flexibility, and those who can provide it will benefit.
Key facts:
Negative price hours in 2025: 573 hours (CHP Information Center, EPEX Spot, as of March 11, 2026)
Negative days in 2025: 110 days – prices were negative on every third day of the year
Lowest price: –€250.32/MWh on May 11, 2025, at 1:00 p.m.
Record month: June 2025, with 141 negative hours on 23 days
Share of PV: ~16% of Germany’s total solar power in 2025 was generated during hours when electricity prices were negative
Time series: From 69 negative hours (2022) to 573 hours (2025) – a 730% increase over three years
The Solar Peak Act, in effect since February 25, 2025, addresses this development with two key provisions: In the event of negative prices, the EEG feed-in tariff for new systems of 2 kWp or more is suspended starting from the first quarter-hour of negative prices (previously: only after several consecutive hours of negative prices). Additionally, effective February 25, 2025: New PV systems without a smart meter gateway may feed a maximum of 60% of their rated capacity into the grid (Section 9(2) EEG, as amended)—a direct incentive to optimize self-consumption or integrate storage. To compensate, Section 51a of the EEG extends the subsidy period by the number of lost remuneration hours—the total subsidy amount thus remains the same; only the timing shifts.
Our article on the direct marketing of PV electricity and current market prices explains in detail what this means for investors: In 2025, the average annual market value for solar power was just 4.508 ct/kWh—well below the spot market average of 8.93 ct/kWh. Investors who lack battery storage or a direct marketing strategy are systematically forfeiting potential returns.
⚠️ Data on negative price hours varies depending on the source and calculation method (hourly values vs. quarter-hourly values after October 2025). The figures provided are sourced from the CHP Information Center (EPEX Spot), the Federal Network Agency (SMARD), and pv magazine. All information is provided without warranty. As of March 2026.

5. Energy Storage Market: 25 GWh cumulative; large-scale storage grows by 62%
By the end of 2025, PV systems with battery storage had been installed in Germany with a cumulative capacity of approximately 25 GWh—spanning roughly 2.2 million systems. According to BSW Solar, capacity has increased fivefold within four years. The most dynamic segment: large-scale storage systems over 1 MW grew in 2025 at a rate of +62% in terms of capacity.
Detailed figures for the German storage market at the end of 2025:
Inventory & Capacity
Total battery capacity: 25–25.5 GWh (a fivefold increase in 4 years, BSW Solar)
of which home storage: ~21–22 GWh (the majority of installed capacity, approx. 2.4 million systems)
of which large-scale storage (>1 MW): ~3.2–3.7 GWh cumulative
Total battery capacity: just under 16 GW
Total number of systems installed: approx. 2.2–2.4 million
Expansion 2025
Total capacity increase: 6.5–7.3 GWh
Large-scale storage expansion (>1 MW): 83 new projects · 667 MW of capacity · 1,244 MWh of storage capacity
Large-scale storage capacity growth: +62% compared to 2024
Residential PV segment: Demand down 8%, but average system size increased (from 9.3 to 10.3 kWh)
Pipeline & Outlook
Planned large-scale storage facilities (MaStR): 460 projects with 4.9 GW / 10.1 GWh
Grid connection requests submitted to 4 TSOs: 650 requests totaling approximately 226 GW of capacity
| Key figure | Value 2025 | Change from 2024 |
|---|---|---|
| Total cumulative capacity | 25–25.5 GWh | +A fivefold increase in 4 years |
| of which home storage | ~21–22 GWh | Demand –8% |
| of which large-scale storage (>1 MW) | ~3.2–3.7 GWh | +62 % |
| Total new construction in 2025 | 6.5–7.3 GWh | +8 % |
| New large-scale storage projects | 83 projects | 667 MW · 1,244 MWh |
| Pipeline (MaStR, >1 MW) | 460 projects | 4.9 GW / 10.1 GWh |
| 2030 Target (BSW Solar / Fraunhofer ISE) | 100–104 GWh | 4 times the current inventory is required |
Sources: BSW Solar (Jan. 2026), pv magazine / RWTH Aachen ISEA (Jan. 2026), Modo Energy (Feb. 2026), Market Master Data Register. All information is provided without warranty. As of February 2026.
The target: BSW-Solar is calling for a fourfold increase to 100 GWh by 2030. Fraunhofer ISE forecasts 104 GWh by 2030 and 178 GWh by 2040. Currently, only 25 GWh is installed—reaching that goal will mean structural growth for anyone who invests in storage now.
The strategic context: According to a white paper by 8Energies, Enspired, and Goldbeck Solar (February 2026), co-location models—that is, battery storage systems installed right next to PV systems—can increase the internal rate of return (IRR) of a PV project by up to 29%. Our article on battery storage and dynamic electricity rates explains why this works.
⚠️ The IRR uplift of up to 29% is based on the co-location white paper by 8Energies, Enspired, and Goldbeck Solar (Solarserver, February 2026). Return figures are not a guarantee of future results. All information is provided without warranty. As of February 2026.
6. Three Drivers: Why Renewable Energy Will Set the Pace in 2025
The solar boom in 2025 is not simply the result of a sunny summer. Three structural forces are driving this trend—and they reinforce one another: regulatory certainty, economic appeal, and the systemic necessity of an energy transition, which makes the grid increasingly reliant on flexible generators.
Driver 1: Regulatory certainty with 20-year EEG feed-in tariffs
The EEG guarantees a fixed feed-in tariff for photovoltaic systems up to 750 kWp for 20 years. For ground-mounted systems, there are tenders with guaranteed prices. Both mechanisms create framework conditions that are rarely available to other asset classes. Even the Solar Peak Act—which excludes hours with negative prices from the feed-in tariff—maintains the total volume of subsidies by extending the subsidy period. The photovoltaic expansion target of 215 GW by 2030 is politically binding. In addition, balcony power plants are further driving expansion: by 2025, approximately 430,000 new balcony solar systems had been installed, which broadly establishes consumer access to solar energy (Federal Network Agency, January 2026).
Driver 2: Economic appeal at an all-time high
System costs for ground-mounted solar parks (open-field installations of 750 kWp or more) will range from €600 to €1,000 per kWp in 2026, while costs for commercial rooftop installations (30–100 kWp) will range from €800 to €1,300 per kWp (Fraunhofer ISE / BSW Solar, Q1 2026). The benchmark average for turnkey systems is ~€1,015/kWp (Fraunhofer ISE, July 2024). The levelized cost of electricity (LCOE) for ground-mounted PV ranges between 4.1 and 6.9 ct/kWh depending on the location (Fraunhofer ISE, July 2024). Total PV capacity in Germany now exceeds 116 GW—a scale that drives the industry toward economies of scale and further reduces costs.With a feed-in tariff of 5.50 ct/kWh (EEG rate for 40–100 kWp partial feed-in, effective Feb. 1–July 31, 2026) and simultaneous savings on commercial electricity prices of 25–35 ct/kWh for self-consumption, the business case is robust, even without subsidies.
The growth in generation highlights the momentum: Total PV electricity generation rose from 61.2 TWh in 2023 to 87.5 TWh in 2025—a 43% increase in just two years (Fraunhofer ISE / UBA, 2026). At the same time, the expansion reflects a structural shift: In 2025, ~17.5 GW of new capacity was installed—a stable pace, though slightly slower compared to the record year of 2023 (15.4 GW → 14.9 GW net). The legally mandated expansion target for 2030 requires an average of around 20 GW annually—this level had not yet been reached by 2025.
⚠️ Information on system costs is based on Q1 2026 market data. Generation data: Fraunhofer ISE Energy Charts v9 (2026) and UBA/AGEE-Stat (March 2026). All information is provided without warranty.
Driver 3: Systemic Necessity – The Grid Must Integrate PV
Germany needs PV not for ideological reasons, but because the system demands it. The grid fee reform (the Federal Network Agency’s AgNes procedure, effective starting in 2029) will introduce dynamic tariffs that reward flexible generators. Storage systems that charge during periods of negative prices and discharge during peak times will become part of grid stabilization. The AGNES reform and its implications for PV investors highlightthe window of opportunity that remains open until the end of 2028.
7. What this means in practical terms for PV investors
2025 shows that the PV market is mature—and, at the same time, where the next shift in returns will occur. Associations such as BSW Solar, the German Solar Industry Association, and the industry as a whole agree: expansion continues to accelerate. This presents four specific entry points for investors.
Entry point 1: Ground-mounted systems
Ground-mounted solar farms with a capacity of approximately 750 kWp or more offer the best system costs and benefit from EEG tenders with guaranteed feed-in tariffs. The risks lie in securing land and grid connection—both of which can be planned with the right expertise.
Entry Point 2: Commercial Rooftop Systems
This segment of the photovoltaic market offers the greatest untapped potential in Germany: over 90% of industrial roofs remain undeveloped. Rooftop systems offer high self-consumption rates (often 40–70%) and thus particularly robust cash flows that are less dependent on wholesale electricity prices.
Entry Point 3: Agri-PV
Agri-PV combines solar power generation with agricultural land use. The benefits include less competition for land, a stronger basis for obtaining permits, and preferential treatment in certain subsidy programs.
Entry Point 4: Battery Storage (Co-location)
The segment with the strongest growth and the clearest case for the system. Anyone who builds a solar farm today and integrates battery storage from the outset (co-location) benefits from arbitrage revenues during periods of negative electricity prices, the potential to sell instantaneous reserve capacity, and a significantly improved IRR.
The key success factors remain the same:
Site availability: Grid connection and permits determine timing and costs
Site quality: Solar radiation and wind conditions in the region account for a significant portion of the variation in yield—reliable production data spanning several years is essential before making an investment decision
Technical Expertise: Fraunhofer ISE reports that operational management quality accounts for 15–20% of the variation in returns
Long-term perspective: Terms of 20–40 years require predictability on the part of the partner
This article is intended solely for general informational purposes and does not constitute investment, tax, or legal advice. Return figures are based on historical data from the Helm Group and are not a guarantee of future results. For advice tailored to your individual situation, please consult a licensed advisor. All information is provided without warranty. As of February 2026.
2025 marks a structural turning point: photovoltaics is no longer a niche technology, but ranks as Germany’s second-largest source of electricity—and is growing faster than any other energy source. The project pipeline is full, the regulatory framework is predictable, and the co-location model with battery storage opens up a new level of returns that did not exist in 2020. Logic Energy designs and builds PV systems—from site screening and financing structures to long-term operations management. If you’d like to know how the 2025 market trend can translate into a concrete investment opportunity for you, contact us—free of charge and with no obligation.
FAQ
-
In 2025, solar power fed more electricity into the German grid than lignite for the first time. With a generation output of approximately 71 terawatt-hours (public grid) and an installed capacity of 116.8 gigawatts, it has become the second-largest source of electricity after wind power.
-
Negative electricity prices occur when electricity supply exceeds demand—typically on sunny or windy days. For plants that are solely grid-connected, this can reduce their revenue. Plants with a high proportion of self-consumption or those equipped with storage systems are less affected by this, as they can use the electricity themselves or sell it at a later time.
-
The energy storage market is growing rapidly. Installed capacity currently stands at just under 25 gigawatt-hours, with the large-scale storage segment having grown by 60 percent by 2025. By 2030, demand is expected to reach 100 to 170 gigawatt-hours—a four- to six-fold increase over today’s capacity.
-
Returns depend heavily on the type of project, the location, and the chosen marketing model. In general, PV investments offer predictable long-term returns, particularly for projects that qualify for EEG feed-in tariffs or have long-term power purchase agreements. Exact return projections should be calculated on a project-by-project basis.
-
Professional project developers manage the entire value chain: from land acquisition through permitting, financing, and construction to long-term operation. As a result, they also bear the implementation risk and have a financial stake in the facility’s long-term success. Pure intermediaries, on the other hand, earn their income from the transaction itself, not from the facility’s operating results.
-
The typical lifespan is 20 to 40 years. The technical lifespan of modern PV modules is 25 to 30 years, although many systems can continue to operate profitably beyond that. Long-term investment models reflect these timeframes.
References
Fraunhofer ISE Energy Charts – Electricity Generation in Germany in 2025 (Prof. Dr. Bruno Burger, Leonhard Gandhi), Version 9, March 28, 2026
pv magazine – Sandra Enkhardt – Energy Charts: Photovoltaics to Surpass Lignite in Net Electricity Generation for the First Time in 2025, January 2, 2026
Federal Network Agency – Press Release: Federal Network Agency Releases Data on the Electricity Market for 2025, January 2026
Federal Network Agency – Press Release: Expansion of Renewable Energies 2025, January 8, 2026
BDEW / ZSW – Renewable energy will account for nearly 56 percent of electricity consumption by 2025, December 2025
Ember – European Electricity Review 2026, January 22, 2026
Ember – Wind and solar generated more electricity than fossil fuels in the EU for the first time in 2025, January 2026
BSW-Solar – Battery storage capacity to increase fivefold within four years, January 12, 2026
pv magazine – Fewer new battery storage systems installed in 2025, but with greater capacity, January 6, 2026
pv magazine – 6.57 gigawatt-hours of new battery storage capacity in Germany in 2025: 8 percent growth, January 8, 2026
CHP Information Center – Negative Electricity Prices: Facts and Statistics, as of March 11, 2026
pv magazine – Marian Willuhn – Photovoltaic generation during periods of negative electricity prices: 90 percent on some days, January 26, 2026
energiezukunft.eu – Electricity Exchange 2025: Extreme Price Fluctuations in the Electricity Market, January 6, 2026
Solarserver / 8Energies – White Paper: Co-location with Battery Storage Ensures the Profitability of Solar Parks (+29% IRR), February 23, 2026